This page is used to monitor uptime and volume of the contribution stream received by our platform.
❗Data used for uptime and volume graphs may be delayed for up to an hour.
The uptime heatmap shows any outages of received audio (incoming stream is offline), and can be browsed by week or allow selecting a specific date:
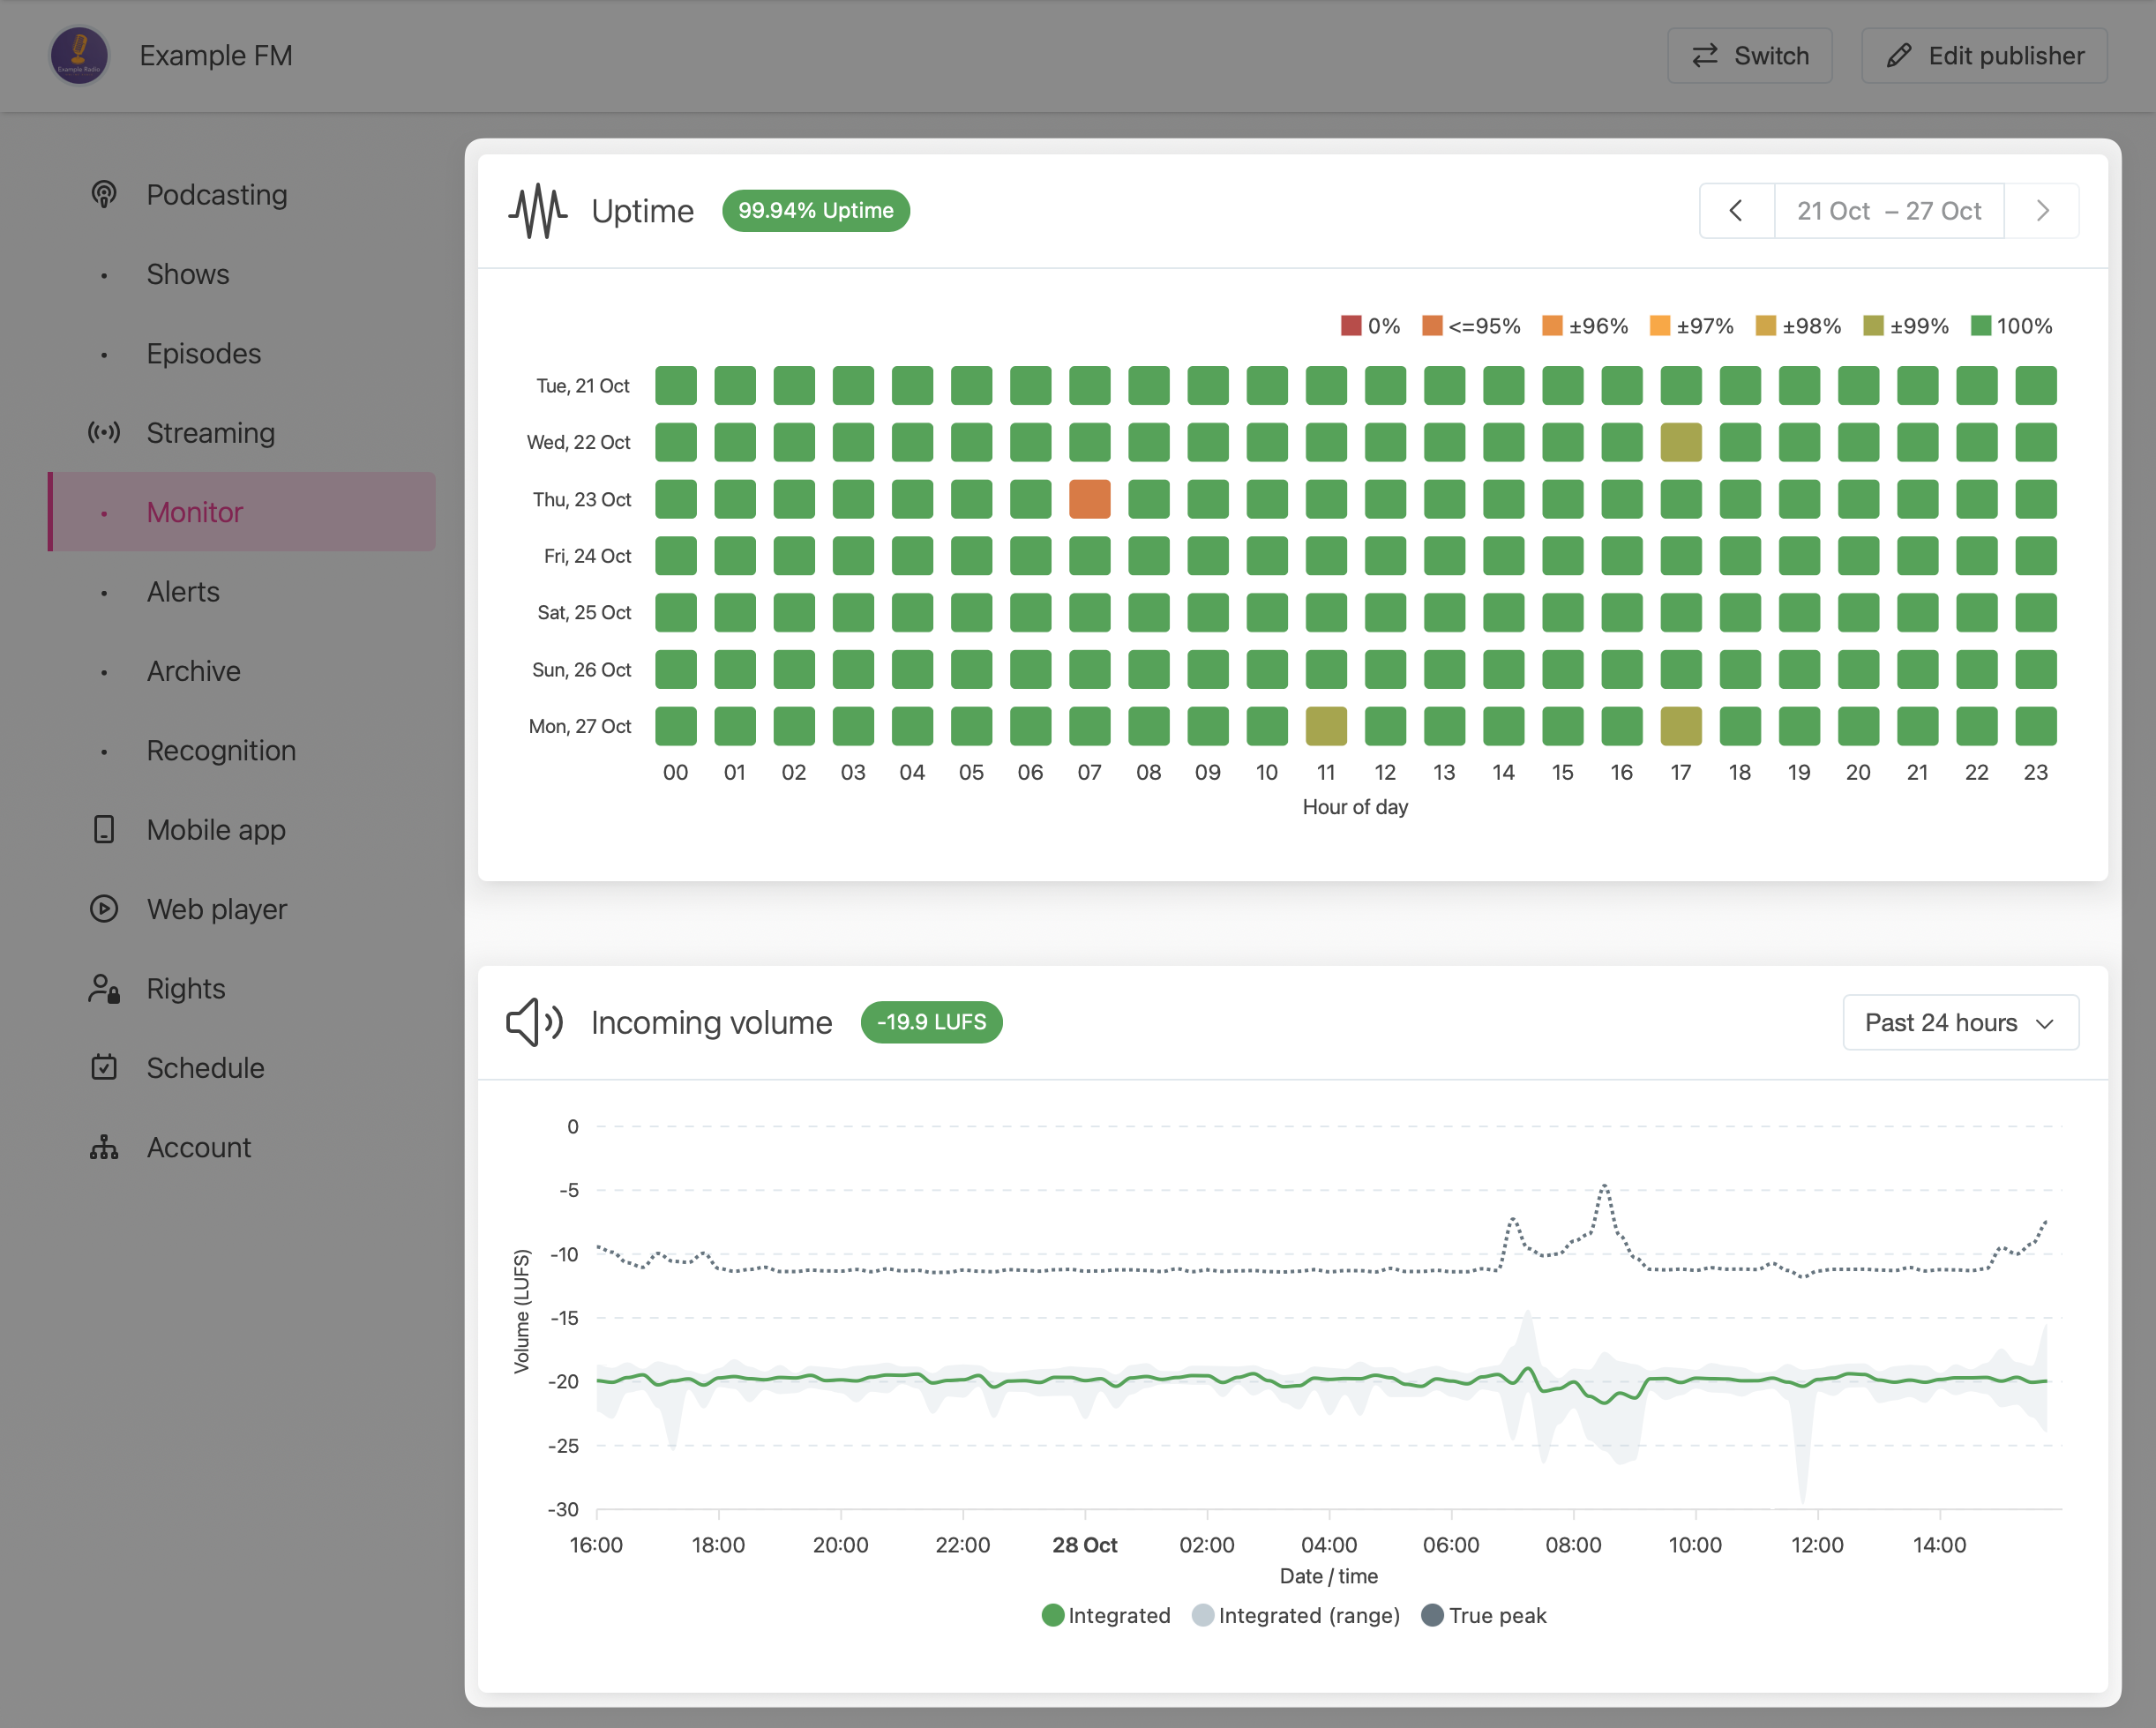
The volume chart displays the loudness of the audio we receive, measured in Loudness Units relative to Full Scale (LUFS) part of the EBU R 128 standard. It also shows the "True Peak" value of the received audio. Volume levels are measured as per minute averages.
The volume chart has a seperate time picker control to change the period being viewed.
Recommended input volume
We recommend sending your audio stream mixed to an Integrated volume of -16 LUFS with an loudness range (LRA) of up to 9 LUFS and a true peak target of -1.5 LUFS. This matches other online audio and video platforms like Youtube or Spotify and allows fair dynamic range.