The analytics portal is available as a web interface which allows browsing, printing and downloading of podcast or stream access data.
See Analytics overview for details on the metrics and data delivered inside this portal.
Interface section
The main interface consists of several functional areas:
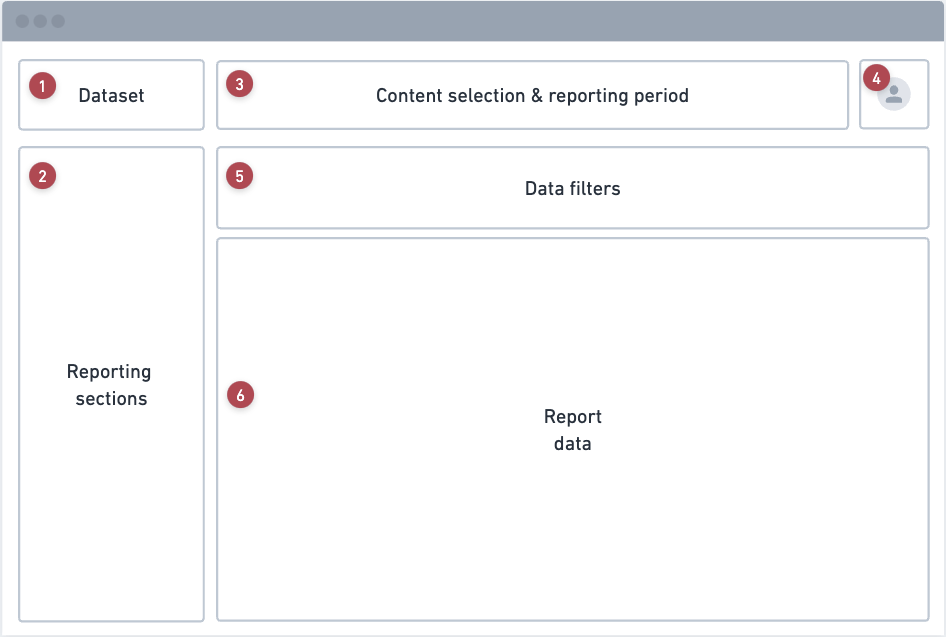
Navigation (section 1,2)
- Enables navigation between different datasets. Switch between analytics for our stream, podcast, ad, recognition and other products. Only products availabe to the logged in user account will be shown.
- Select from different dimensions available for the selected dataset. Available dimensions in this section may differ based on dataset selected and the podcast or stream package of the account.

Content selection (section 3,4)
3.1 Selects which content to include in the report. Some packages allow multiple items to be selected simultaneously, but only allows the same type of resource to be selected at a time - for example combing a podcast channel and radio stream in one report is not possible.
3.2 Control the reporting period. Several preset values are available and the ability to select custom time ranges. The amount of historic data available is limited by the podcast or stream package of the account.
4. The reporting timezone can be changed under the user profile. This allows browsing the analytics adjusted to your local timezone.
Content filters (section 5)
- Data filters can applied to the selected content. This allows filtering by:
5.1 Customer content is always filtered by "Qualified" sessions only.
5.2 Viewing only access from specific countries or regions.
5.3 Viewing only access by specific devices or platforms.
5.4 Viewing only access during specific dayparts.
Same filter types behave as OR statements, different types as AND filters:
Show content where (Country 1 OR Country 2) AND (Region 1 OR Region 2) AND (Devices) AND (Platforms)
Example: selecting Malta and Greece as country filters will show traffic from both these countries, but adding Scotland as region filter will prevent any data from being visible, as no traffic can be from (Malta OR Greece) AND (Scotland).
Selection content (section 6)
The main viewport area with widgets & tables showing all the available audio metrics for the filtered data. The contents of this area is largely determine by the dimension selected in the sidebar. (section 2)
Data dimensions
More than 20 different dimensions are available, each focussed on highlighting a specific aspect of the selected data.
Overview
Summary view which includes all the key metrics, a time-series chart and links to the most relevant sections.
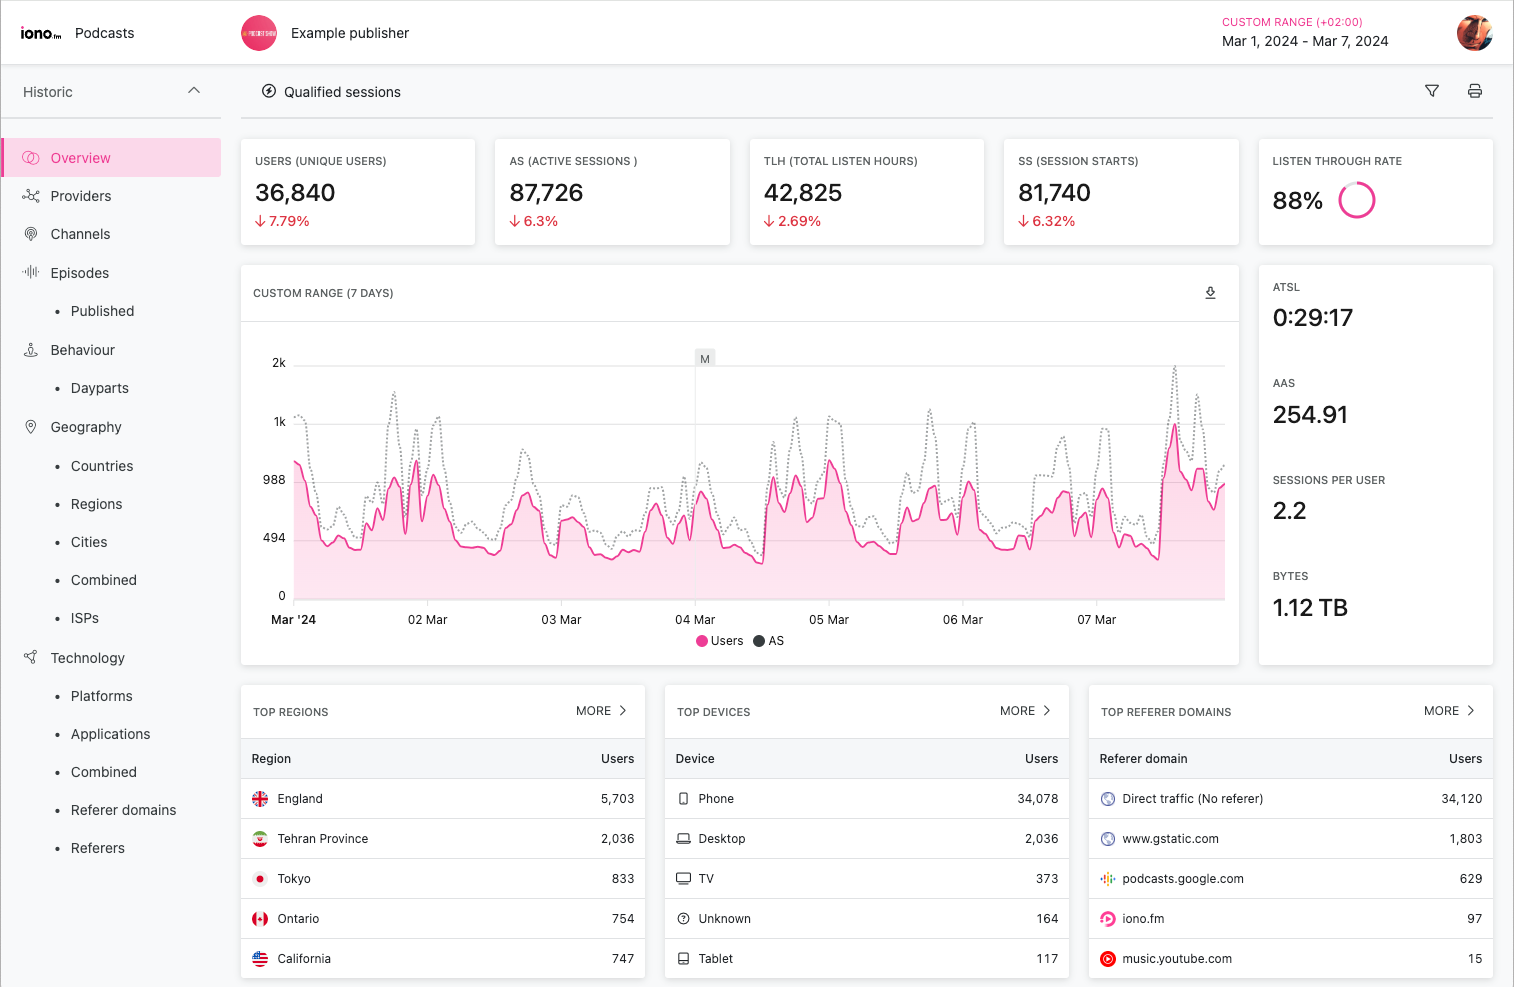
The top metrics on this page shows the percentage change compared to the previous period. This uses a mirror period of the selected reporting period, for example when viewing 2 weeks of data, the previous period will be the two week prior to that.
Important: When reporting on a "month" reporting period, for example September, the previous period is still calculated against the mirror number of days, and is not constrained to the month. In this example, September has 30 days, so it's previous period will be from 2 August - 30 August.
Time series
- The time series chart shows unique users (
Users) and active sessions (AS) over time. - The resolution of this widget adapts to the selected reporting range. Shorter ranges use the minimum
1 HOURresolution, while longer periods may increase to a1 DAYresolution to ensure a consistent number of data points. - A vertical annotation is placed at the start of every Monday in the reporting range. This is labeled with
Mif there are less than10in the reporting period, or reverts to a simple vertical line for larger sets to improve readability. - The CSV download offers additional options to specific the resolution of the downloaded data.
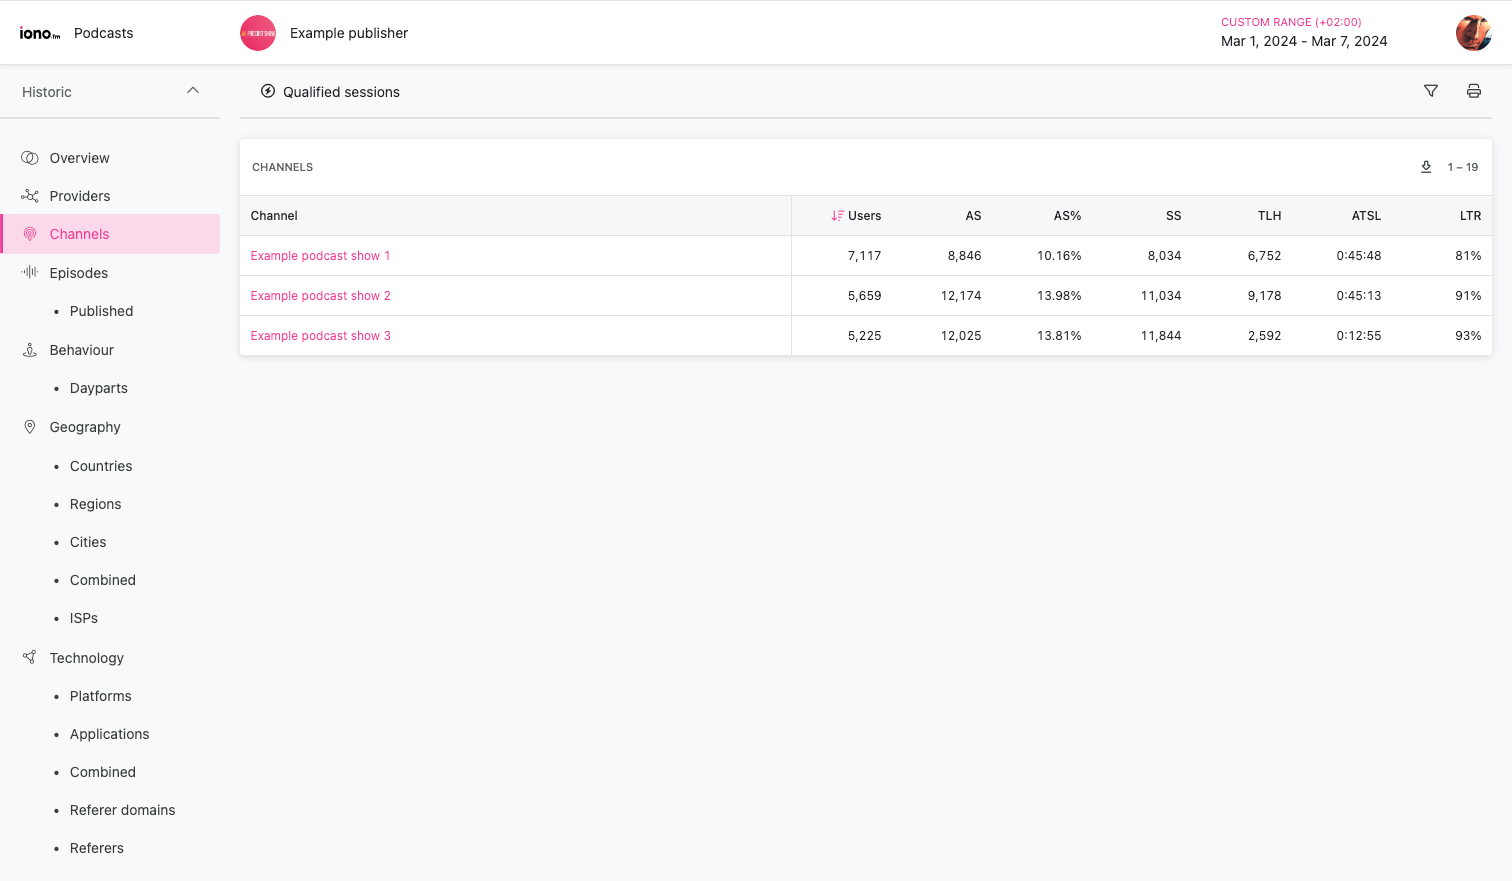
Streams, Channels, Episodes
Depending on the current dataset, this section provides a break-down by stream, podcast show or podcast episode.
Published episodes
Podcast only. Shows content accessed by podcast episode, but filtered to include only episodes that was also published inside the reporting period.
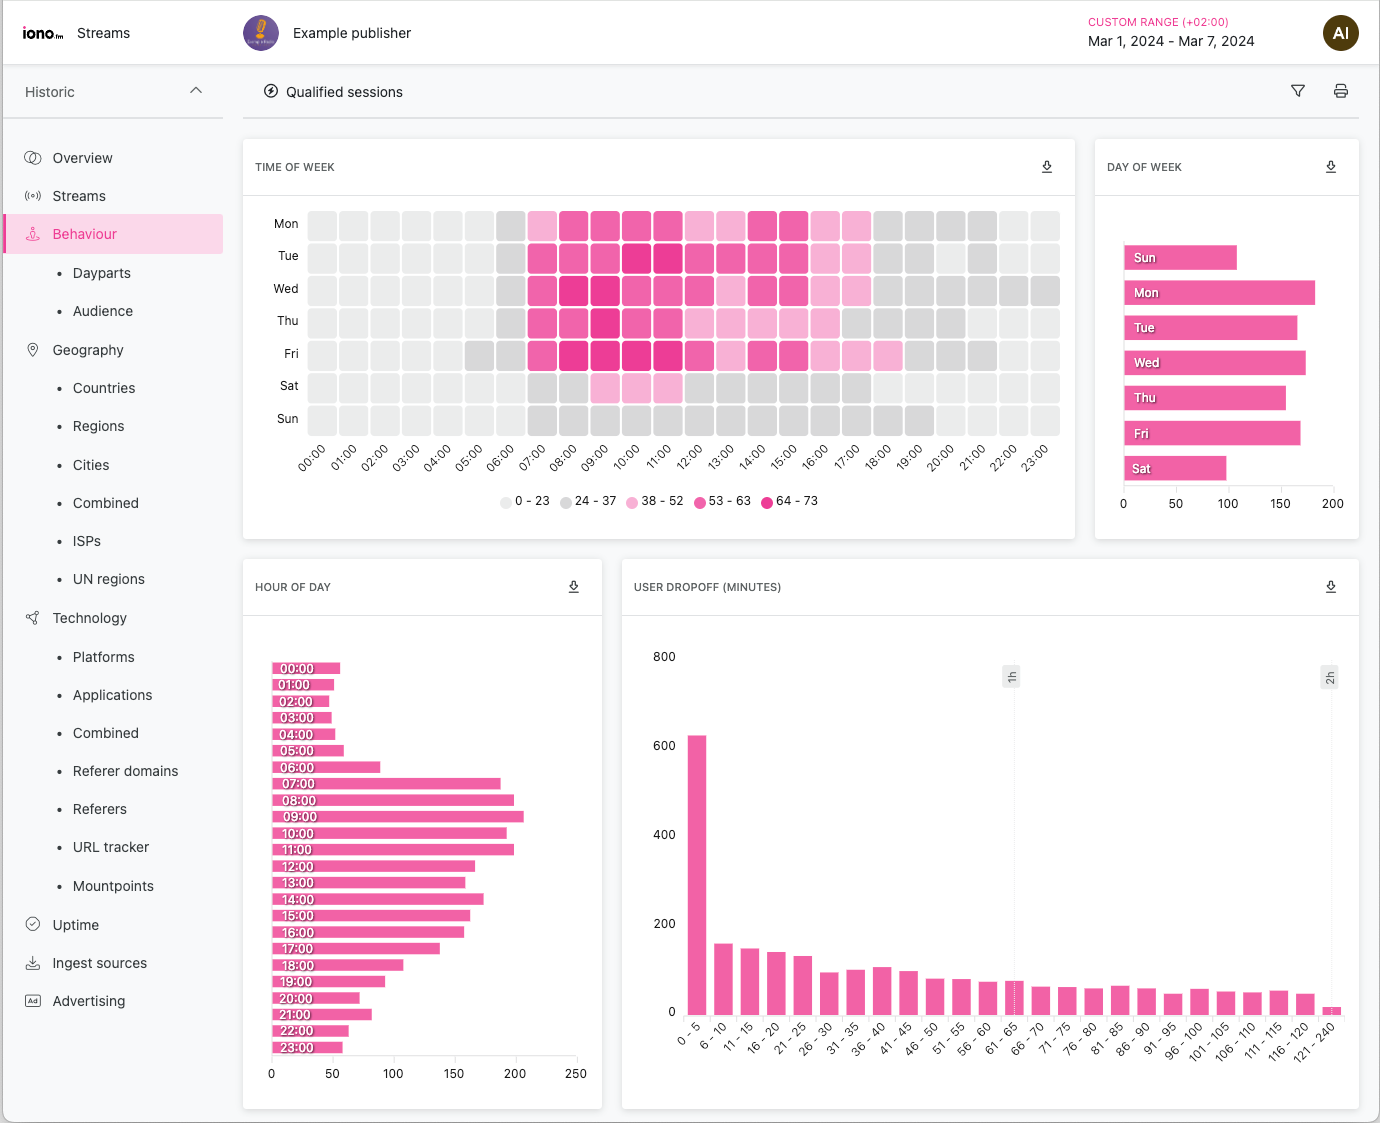
Behaviour
Exposes listening patterns related to when and how much audio was consumed.
Podcast analytics
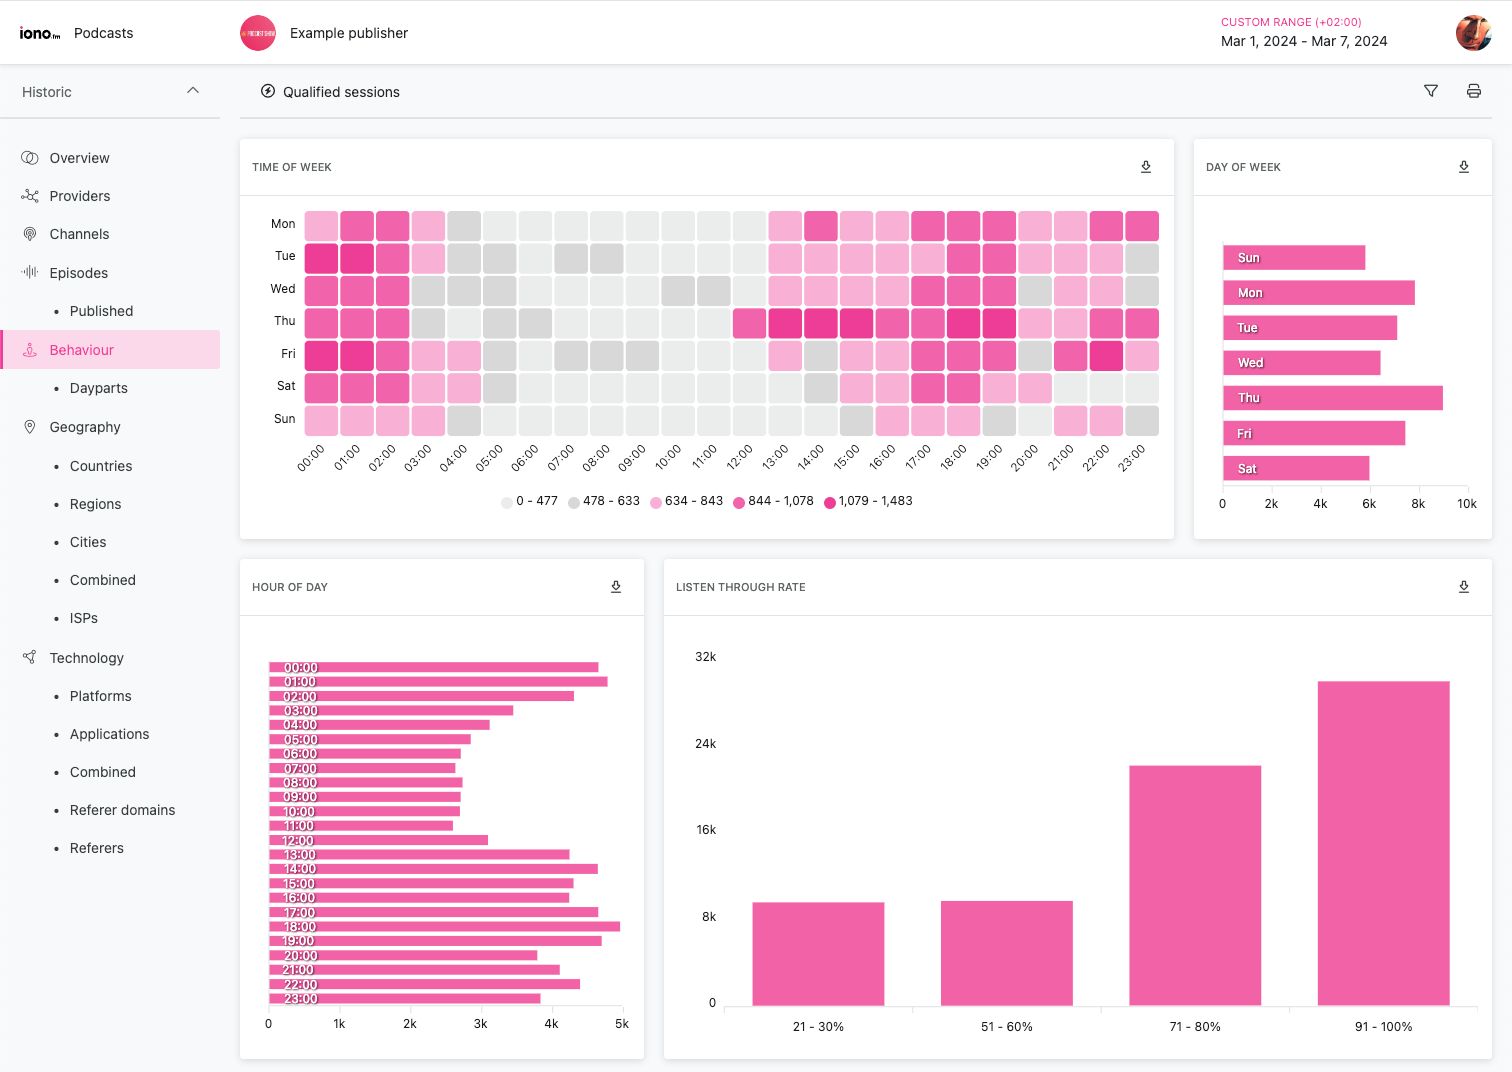
The Time of Week, Day of Week and Hour of Day charts are sensitive to the reporting period. If the selected range does not include a full week's worth of data some entries may be missing. If the reporting period includes an uneven number of days, this may also skew the results.
Podcast analytics displays a Listen Through Rate in percentage buckets indicating how much of the files have been accessed by users. This metric uses percentage buckets instead of listening time to cater for the varying lengths of episodes.
Podcast apps and even web playback typically pre-downloads a large section of the episode audio before playback, skewing the "Listen Through Rate" towards completion. This effect will have a higher impact on shorter episodes, where the entire file is more likely to be downloaded for playback. Any podcast app with "Offline listening" functionality will also skew this result as the entire file is downloaded for later consumption.
Stream analytics
Analytics for radio streaming uses the same conventions as for podcast analytics, except that the "Listen Through Rate" chart is replaced with a "User Dropoff" chart. This is necessary due to podcast data consisting of episodes of finite (but variable) duration while radio streams are continuous 24/7 broadcasts. This means there is no "listen through" for radio streams as they can never be "completed".
The User Dropoff chart breaks user session time into 5 minute buckets to indicate how many listeners reach a certain duration of listening.
Day parts
Content access bucketed by separate parts of the day, a common reporting method for broadcasters.
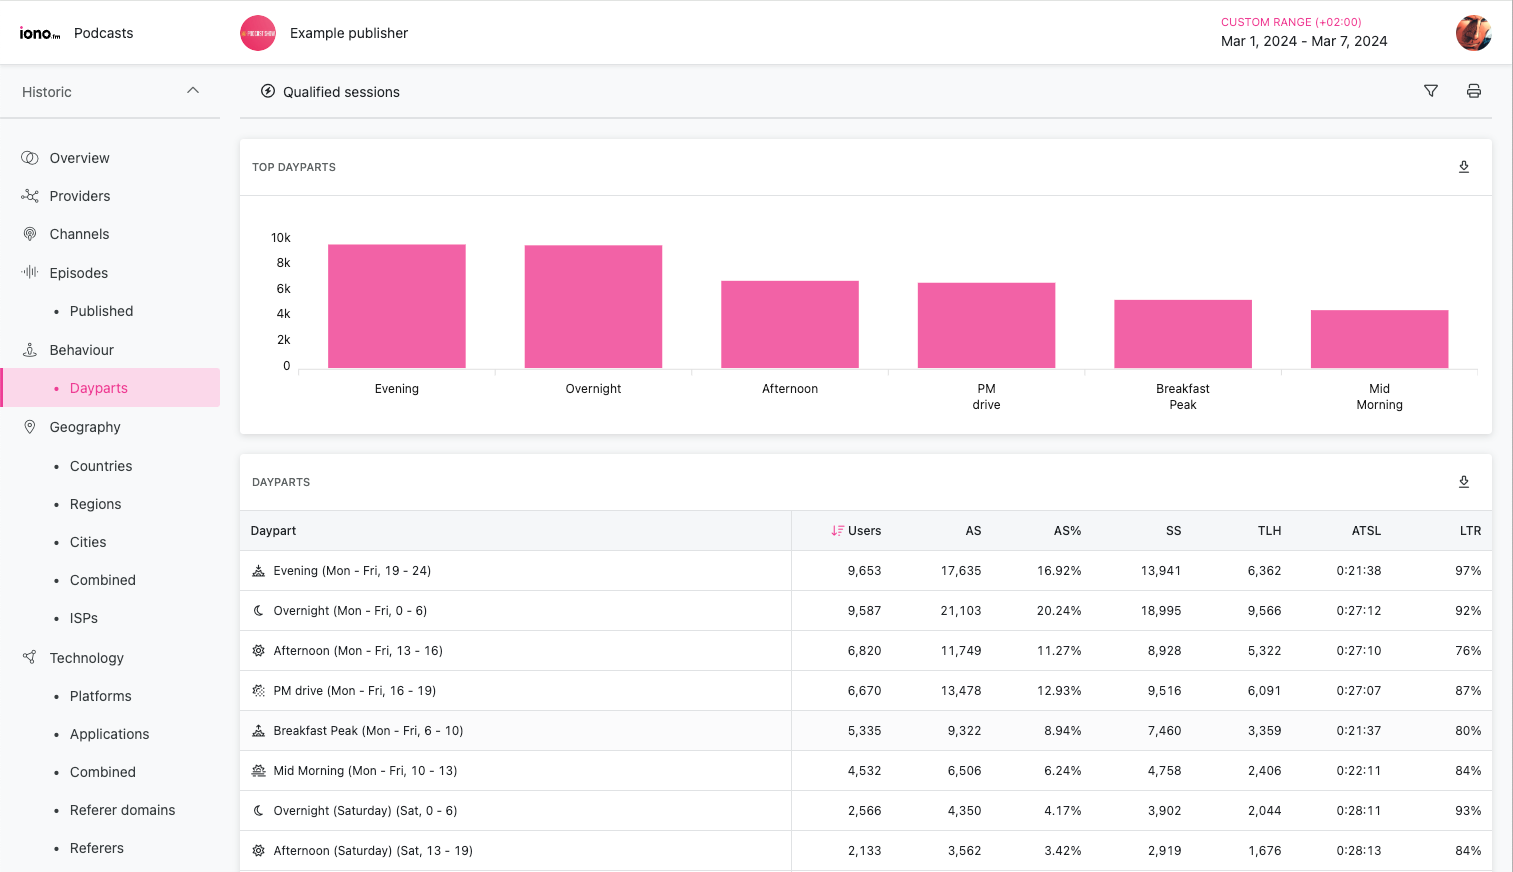
Day parts are based on the United Kingdom's Radio Joint Audience Research (RAJAR) schedule of day parts:
| Day part name | Days of week | Hours of day |
|---|---|---|
| Breakfast peak | All | 06:00 - 10:00 |
| Mid morning | All | 10:00 - 13:00 |
| Afternoon | Mon - Fri | 13:00 - 16:00 |
| PM drive | Mon - Fri | 16:00 - 19:00 |
| Afternoon | Sat, Sun | 13:00 - 19:00 |
| Evening | All | 19:00 - 24:00 |
| Overnight | All | 00:00 - 06:00 |
Daypart ranges are not user adjustable.
Geography
An overview of geographic access patterns with an interactive map and table links of the most relevant geographic data.
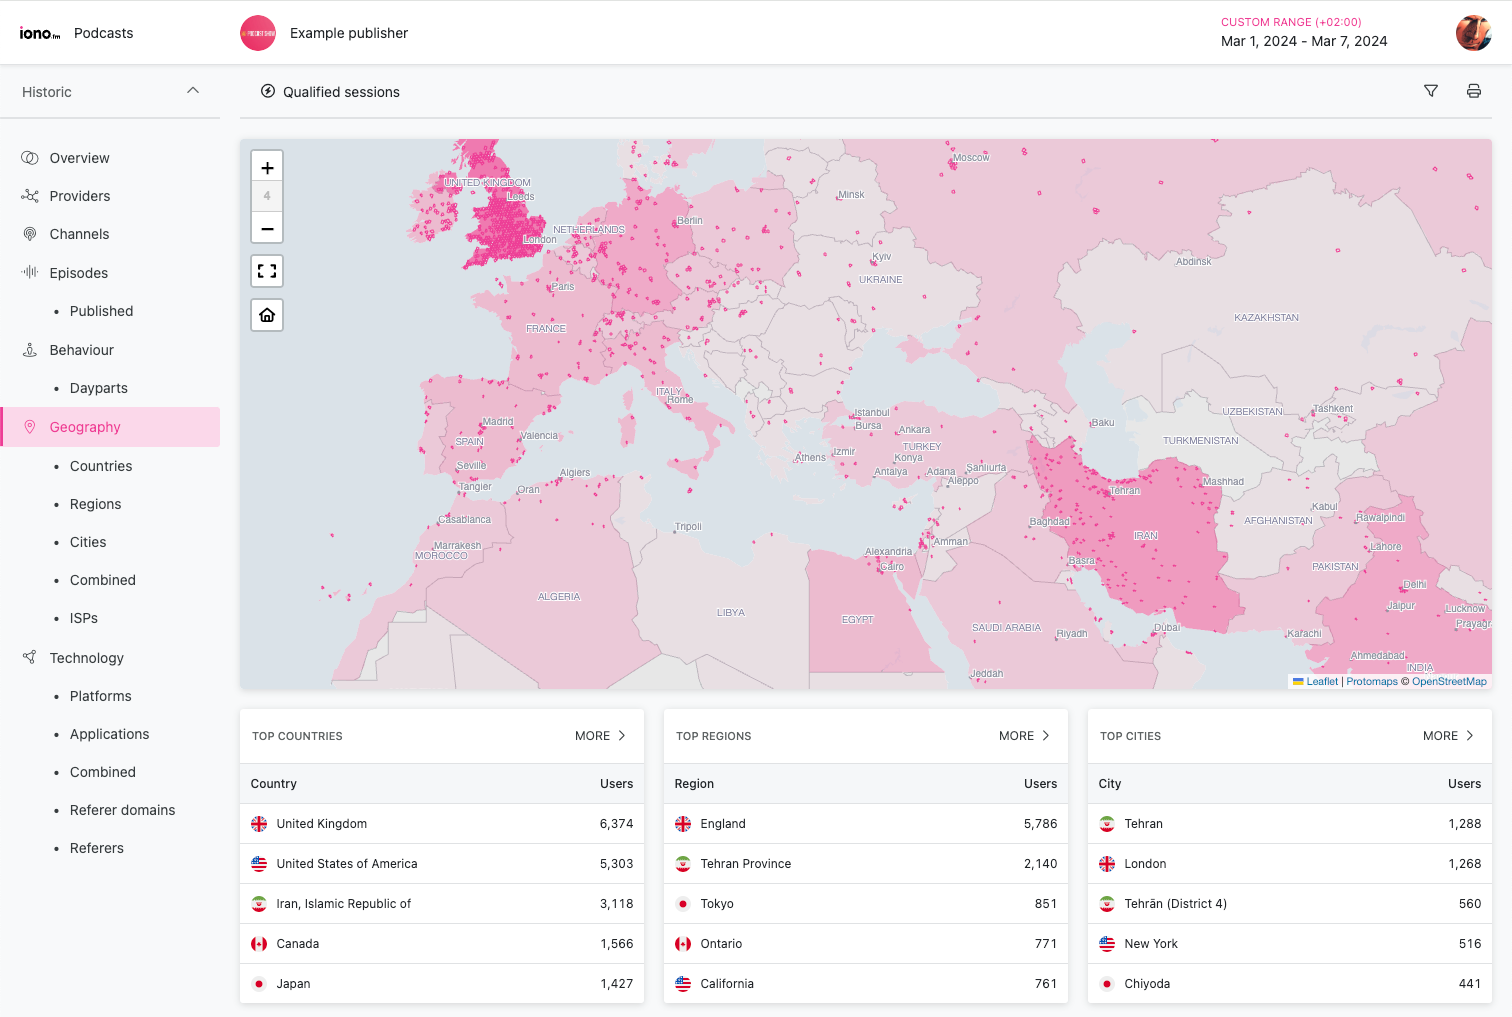
The map provides three different display layers:
- Country choropleth, rendered on the first 3 zoom levels, highlights countries based on their audience size.
- Region choropleth, on the next 3 zoom levels, highlights top level country region based on audience size.
- Location cells, displayed on all zoom levels, clusters audience sizes into hexagons on the map.
All map base layer and choropleth layers are generated from OpenStreetMap data.
Besides standard zooming and panning functionality, the map implements:
- A "Full screen" mode that allows richer exploration,
- A "Home" button to centre the map on the cell with the highest user concentration.
To reduce noise, all map layers exclude data points that contain only 1 user.
Countries
Content access grouped by country.
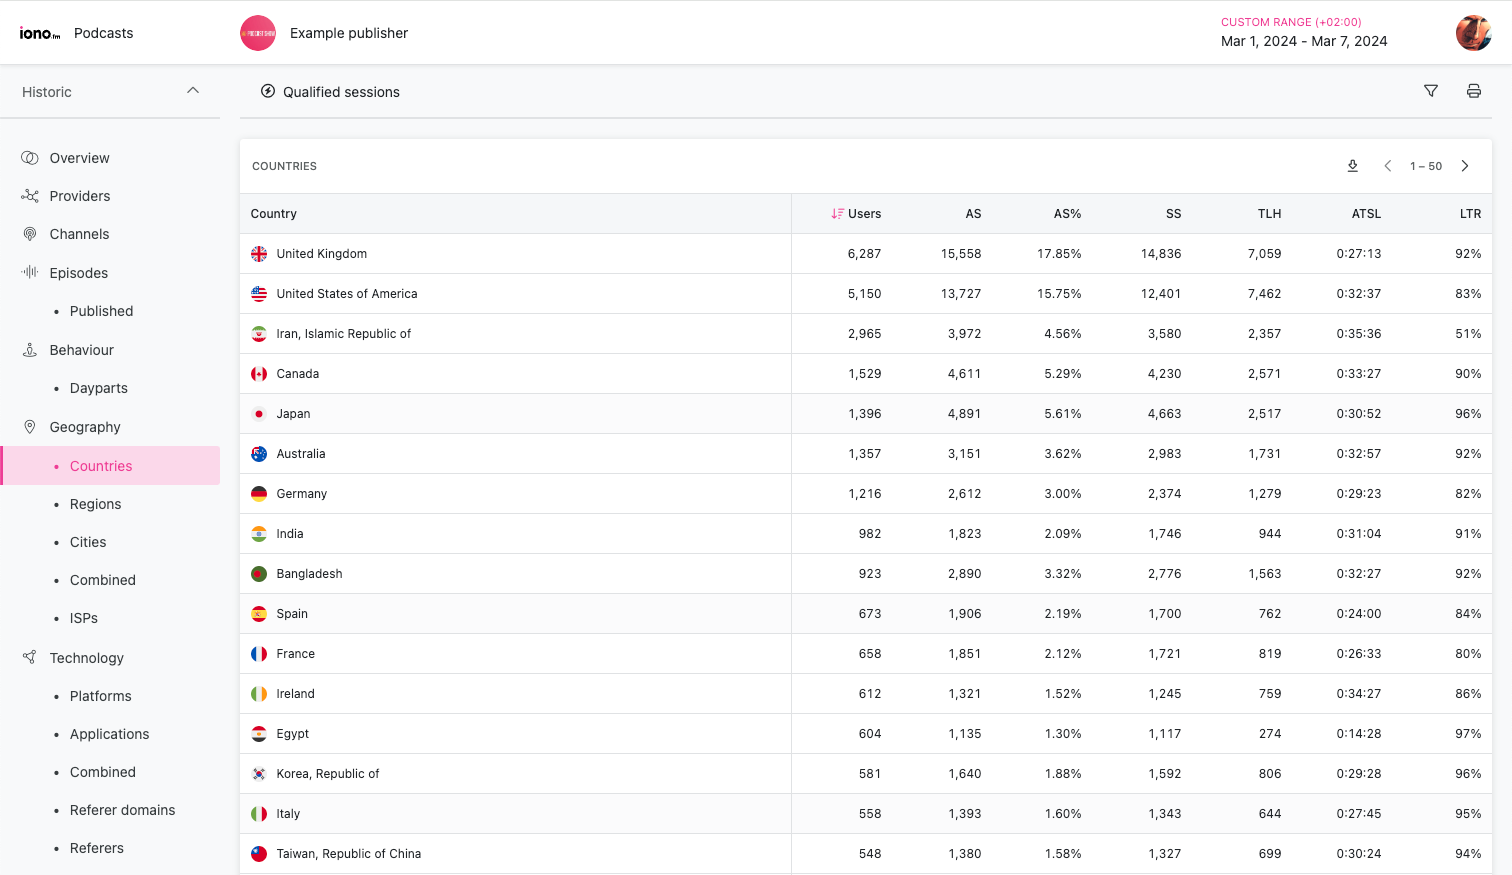
Countries are tracked by their official ISO3166-1 country codes.
Regions
Content access grouped by top-level country subdivision.
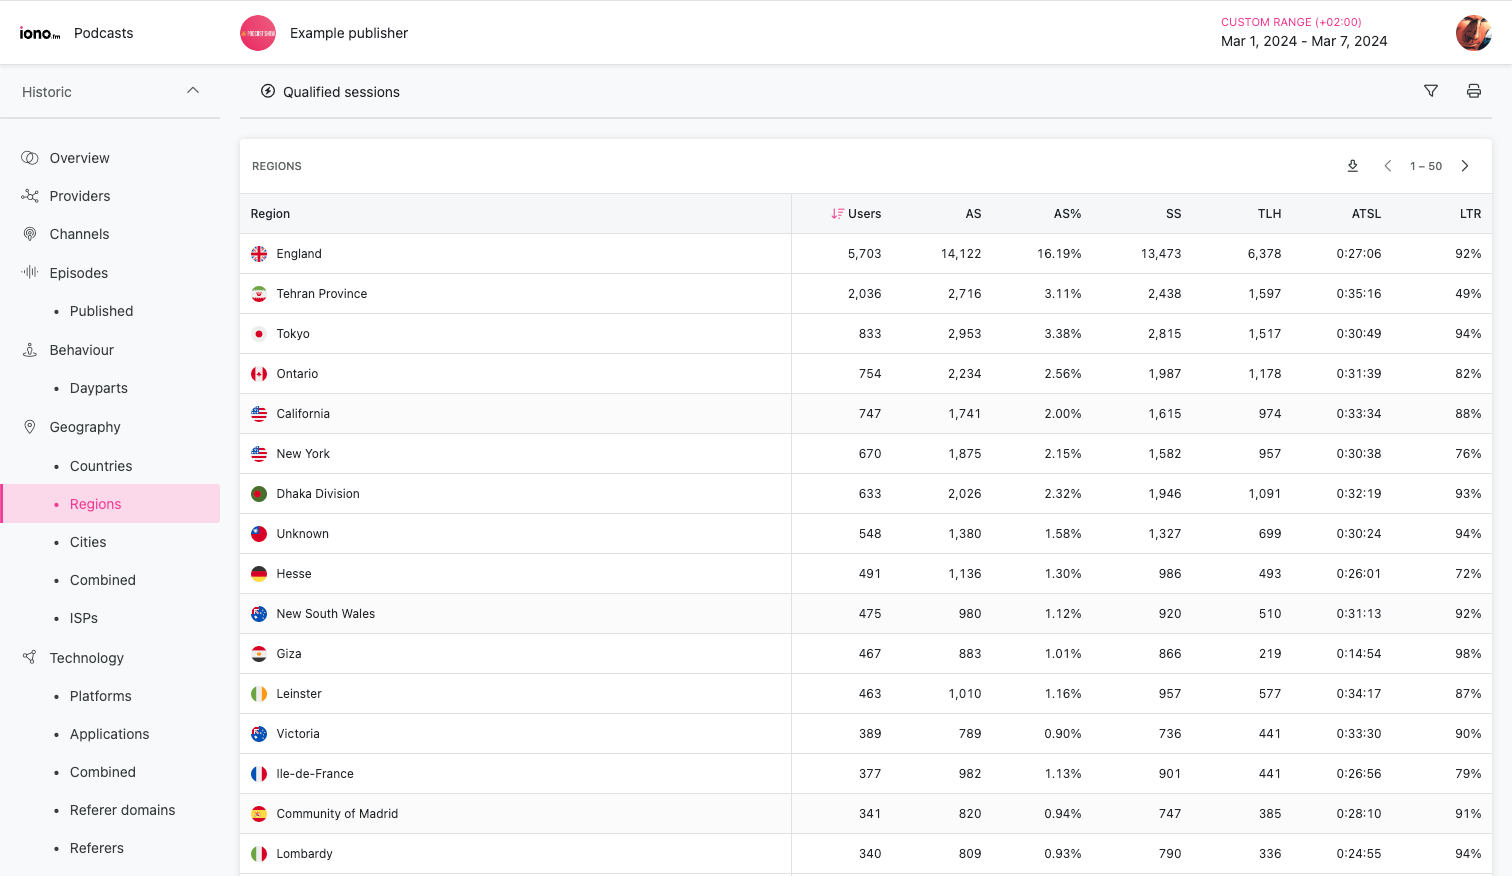
Uses the the official ISO3166-2 administrative boundaries. This data is not always available, and 40+ countries do not currently define any official sub-divisions.
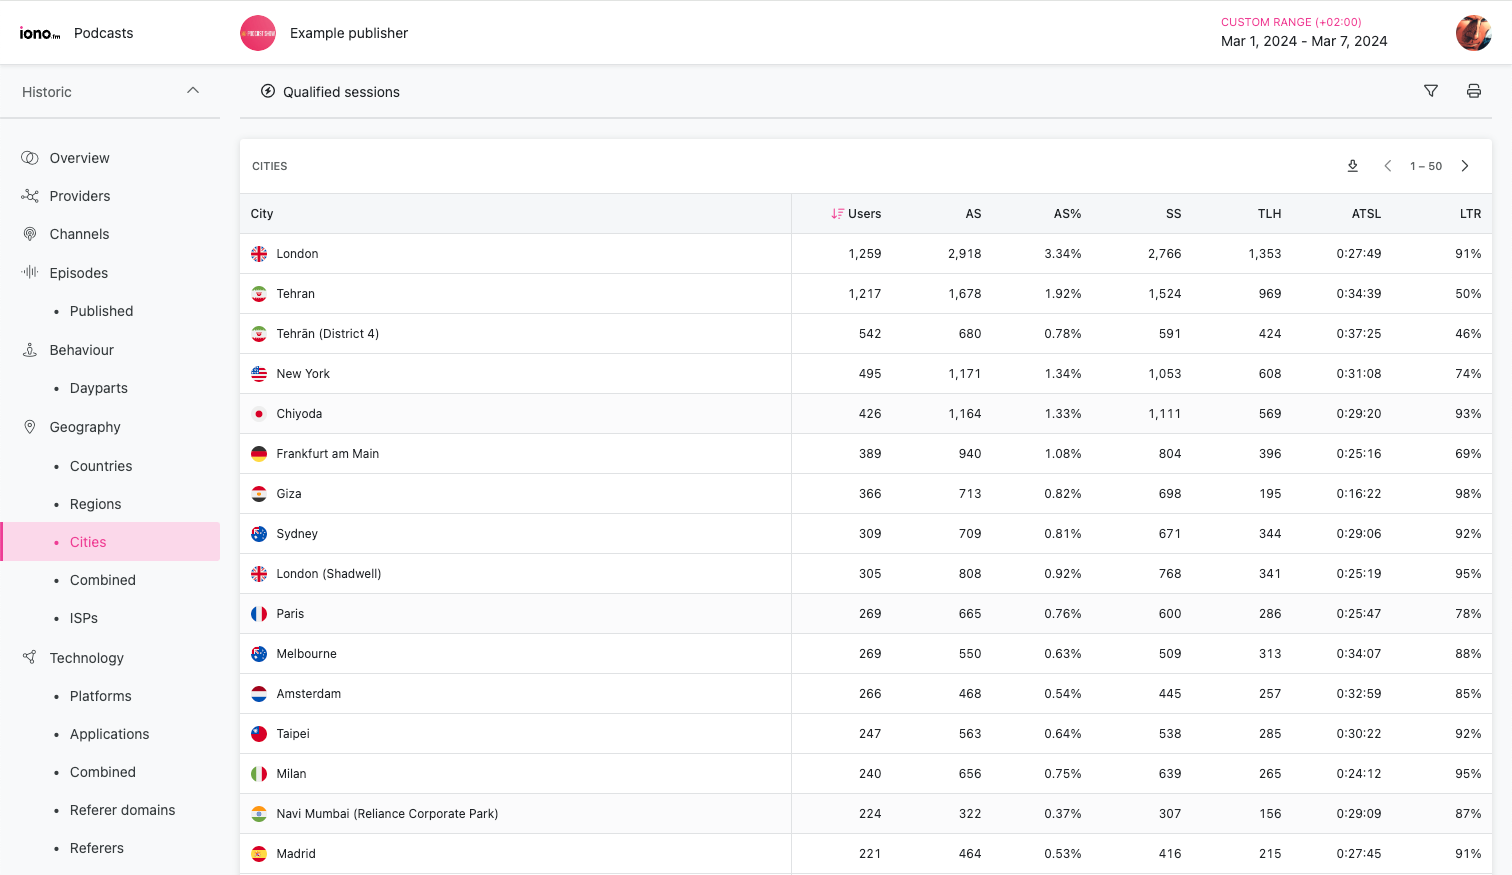
Cities
Content access grouped by city or town name.
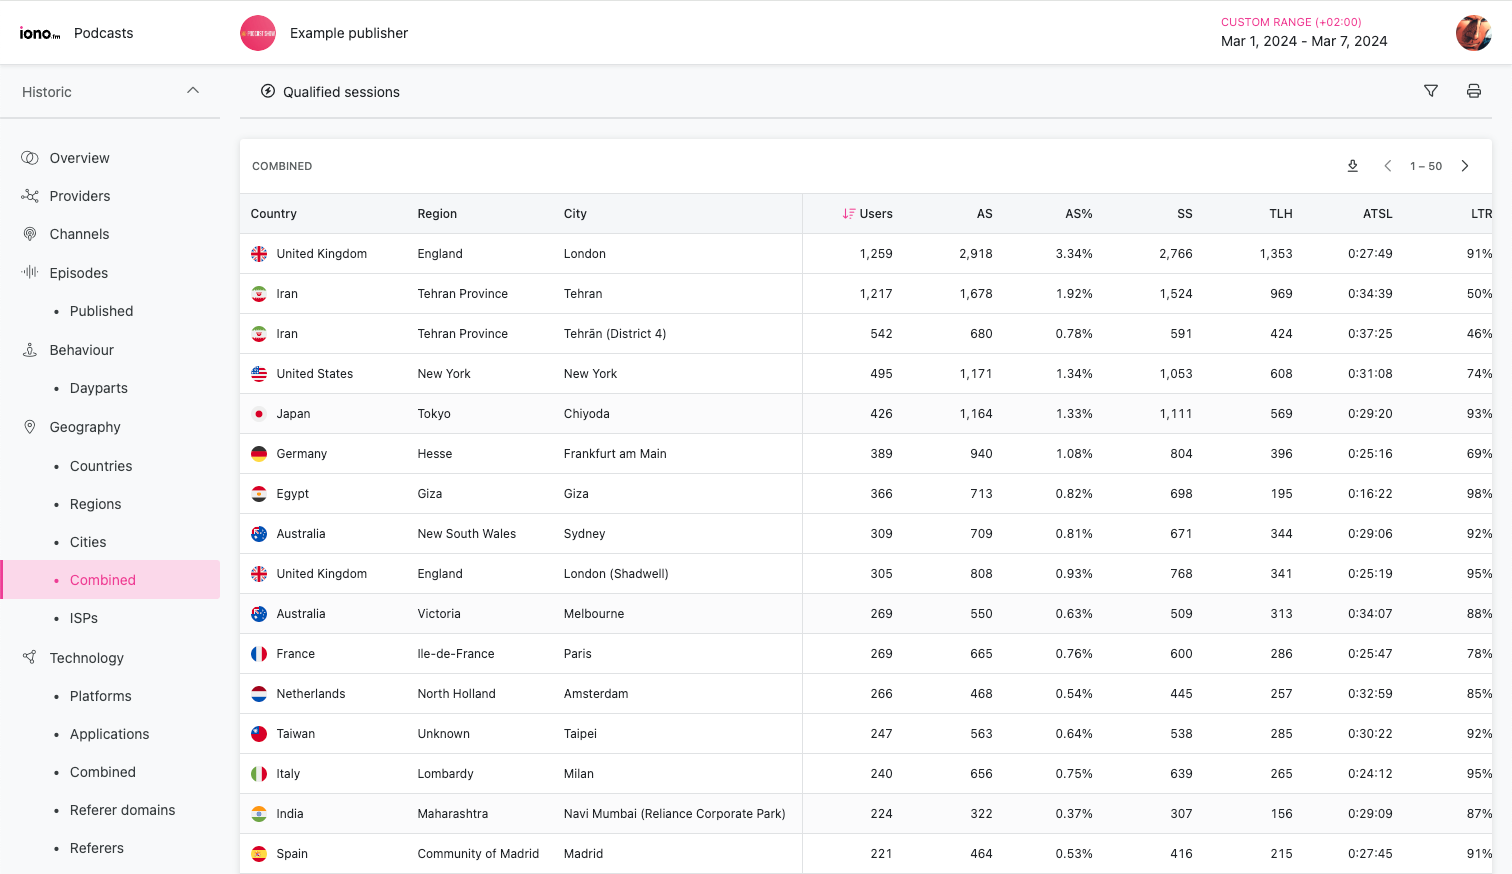
Combined geography
Combines the country, region and city data into a single view.
ISP's
Groups content by the ISP or telecoms provider of the listener.
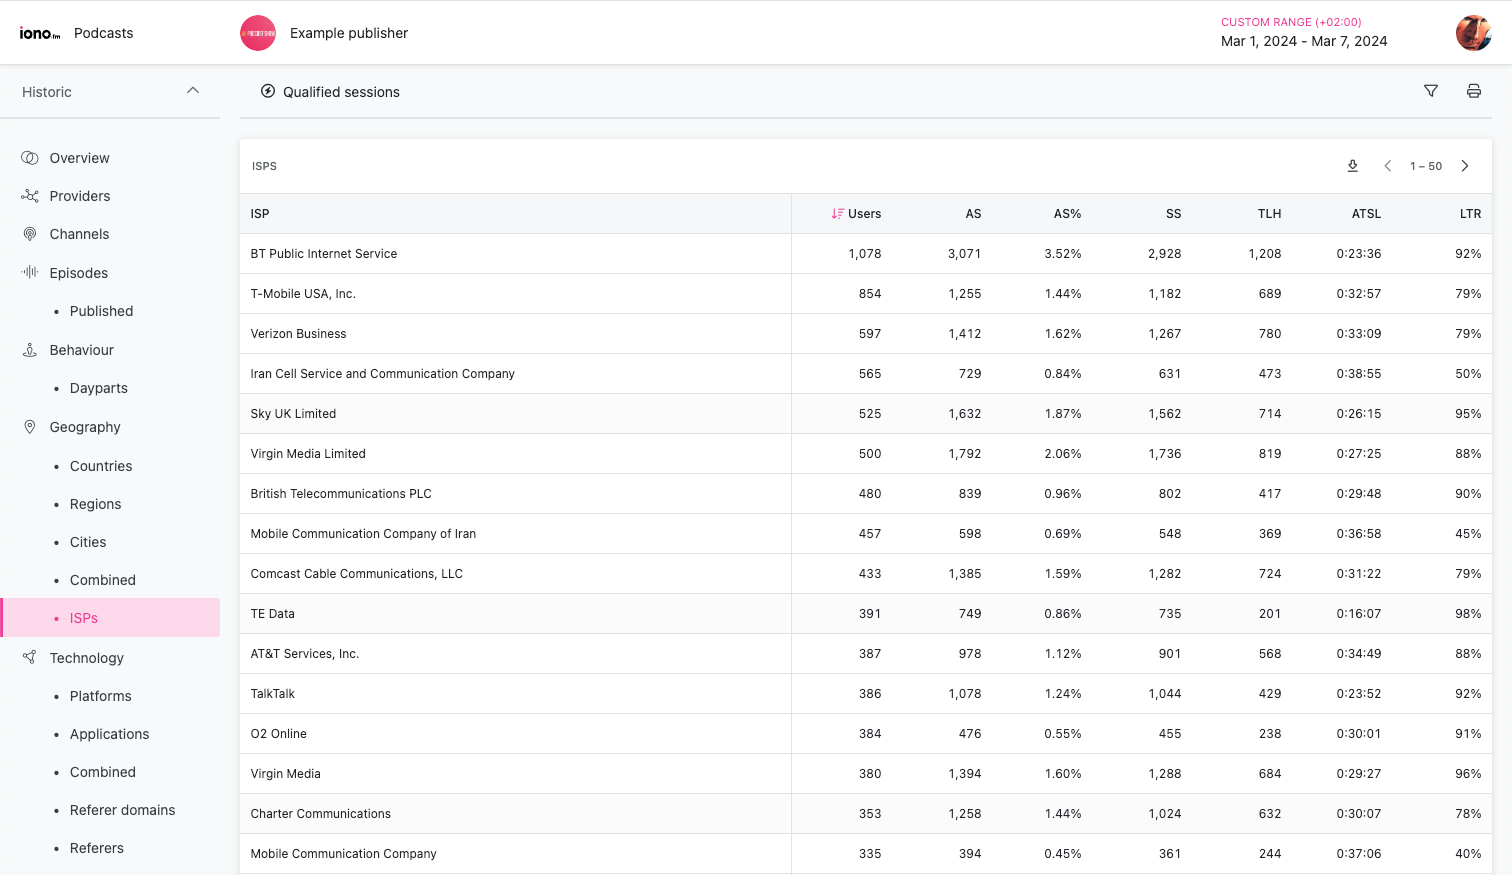
ISP data can provide insights into user connectivity, for example identifying mobile vs landline providers. For customers negotiating zero-rating agreements it's also valuable to understand how much of their data is flowing over the relevant ISP.
Technology
An overview of the technology used by listeners to access the audio content.
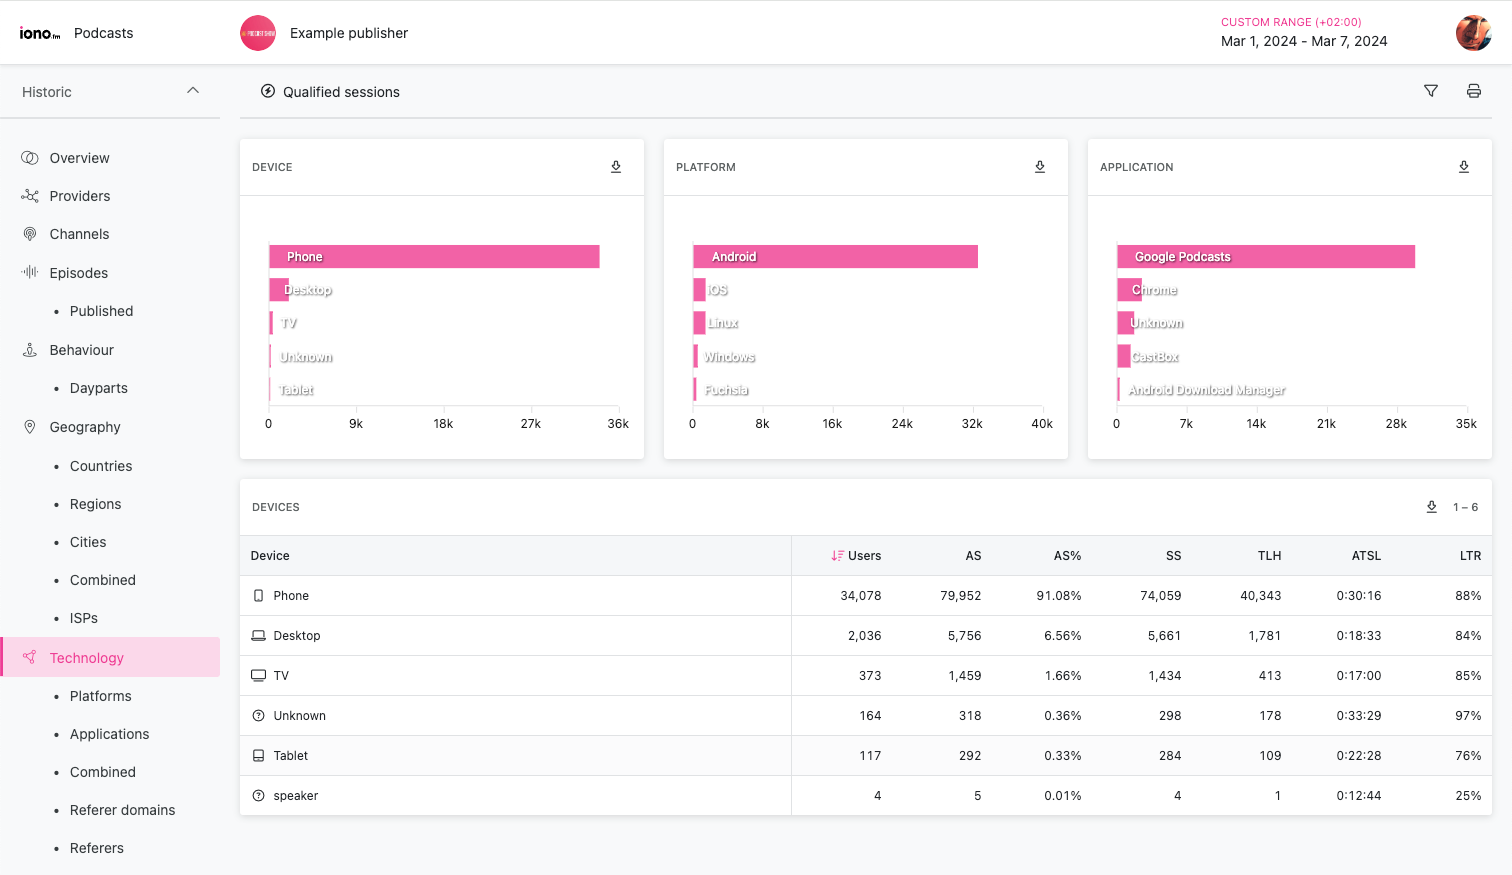
As best as possible, devices are assigned to these categories:
| Name | Description |
|---|---|
| Phone | Mobile phones |
| Desktop | Desktop & laptop class devices |
| Tablet | Handheld tablets, like the iPad |
| Assistant | Smart speakers and home assistants, like Alexa |
| TV | Smart TVs and TV set-top boxes |
| Vehicle | Software running on in-vehicle dashboards |
| Watch | Smart watches |
| Entertainment System | Radio and hi-fi systems that can play online content |
| Media Player | Portable media players, like the iPod |
| Console | Gaming consoles, like the Playstation |
| Audio Equipment | Studio and broadcast equipment, like Barix receivers |
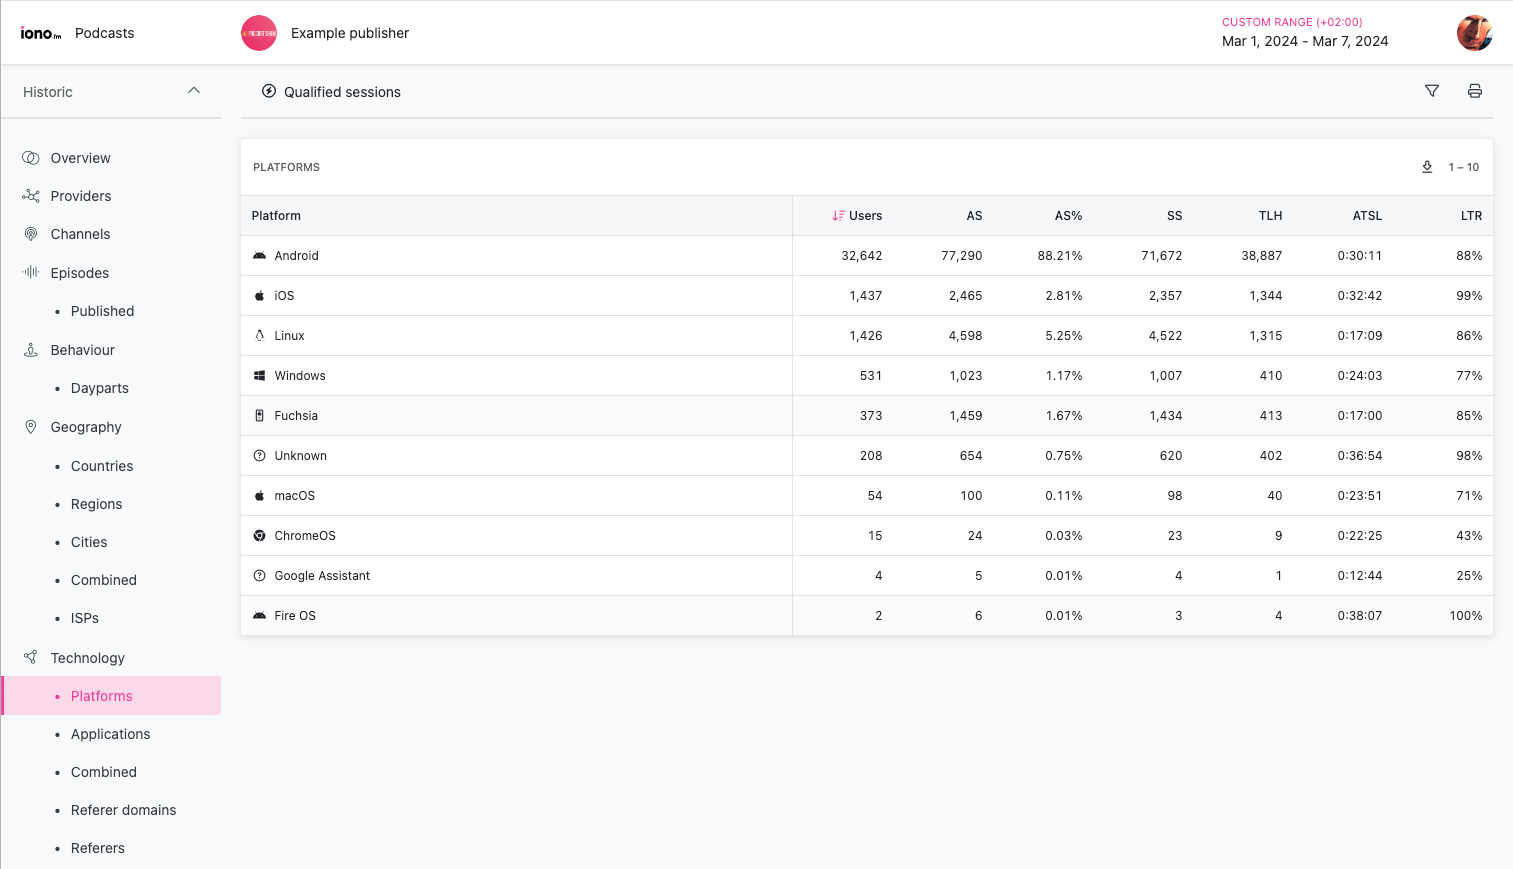
Platforms
Groups content access by operating system.
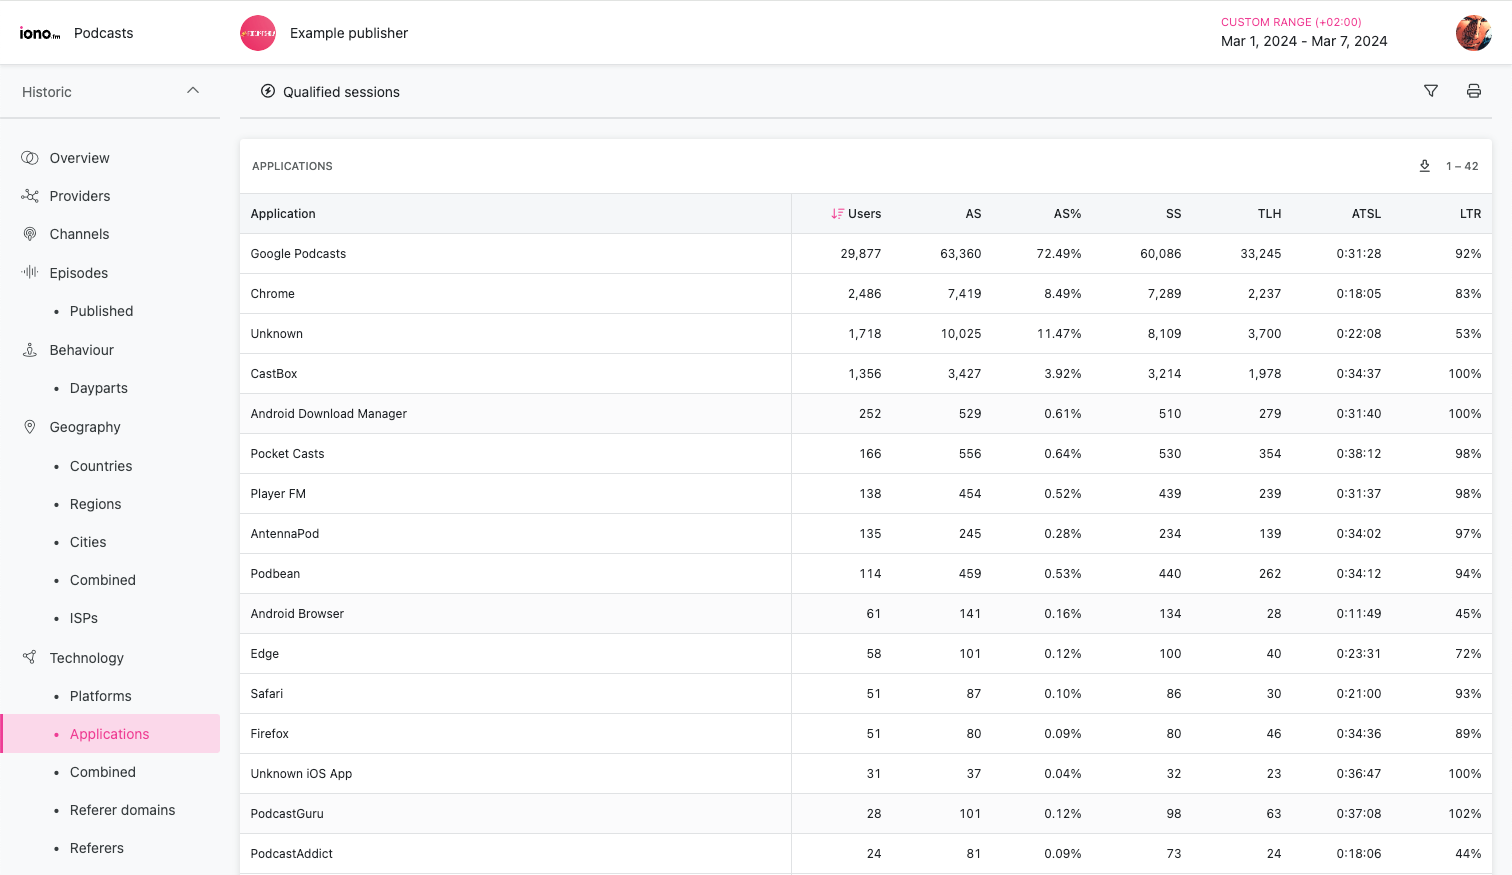
Applications
Groups content by the name of the application.
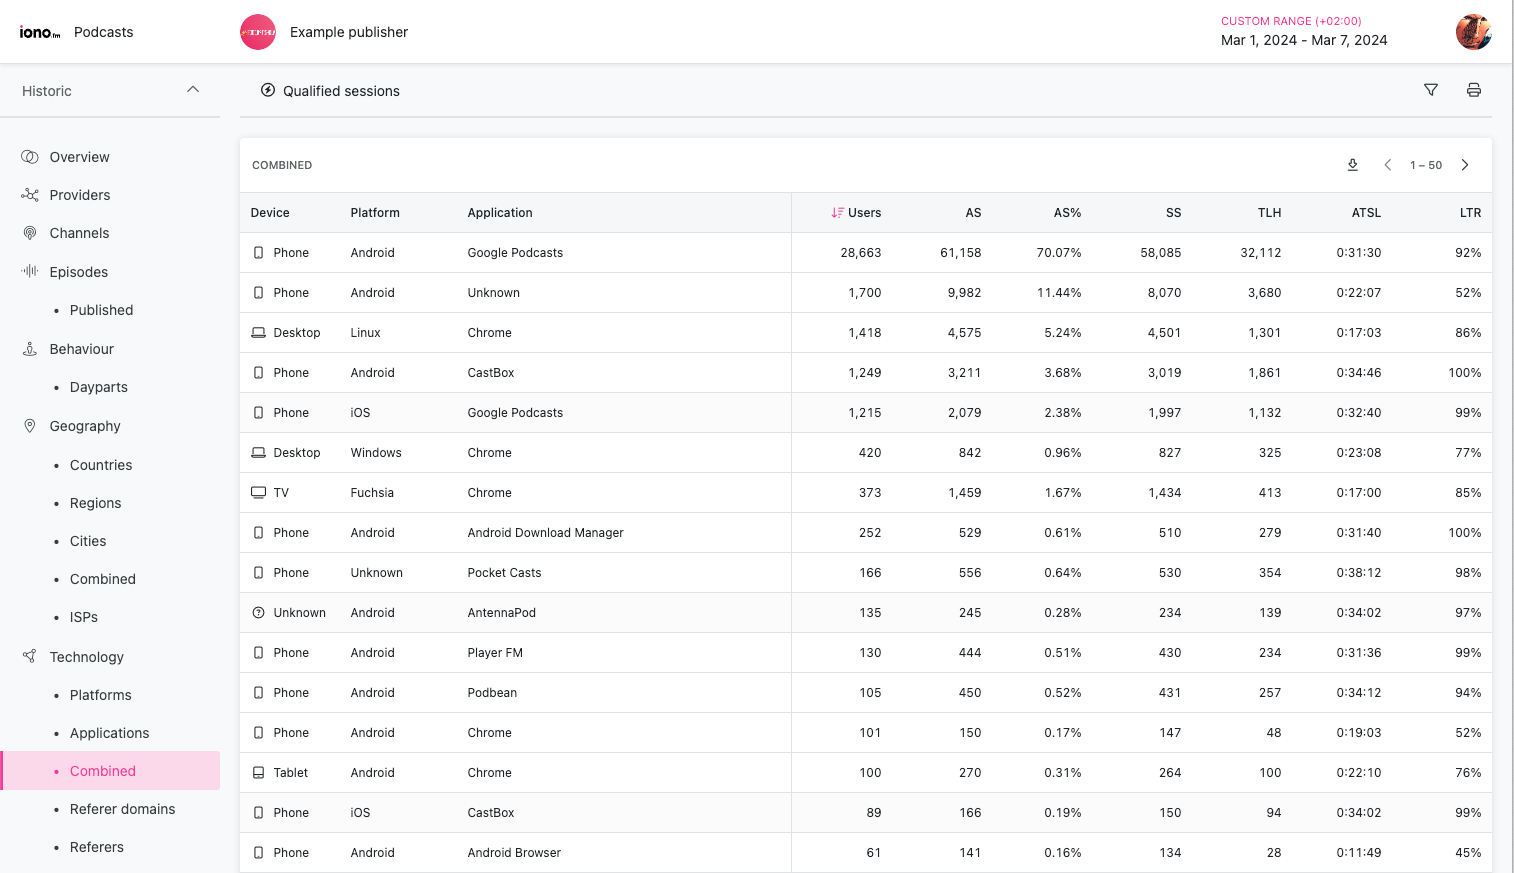
Combined technology
Combines the device, platform and application data into a single view.
Referer domains
Groups content access by the domain name where the web traffic originated.
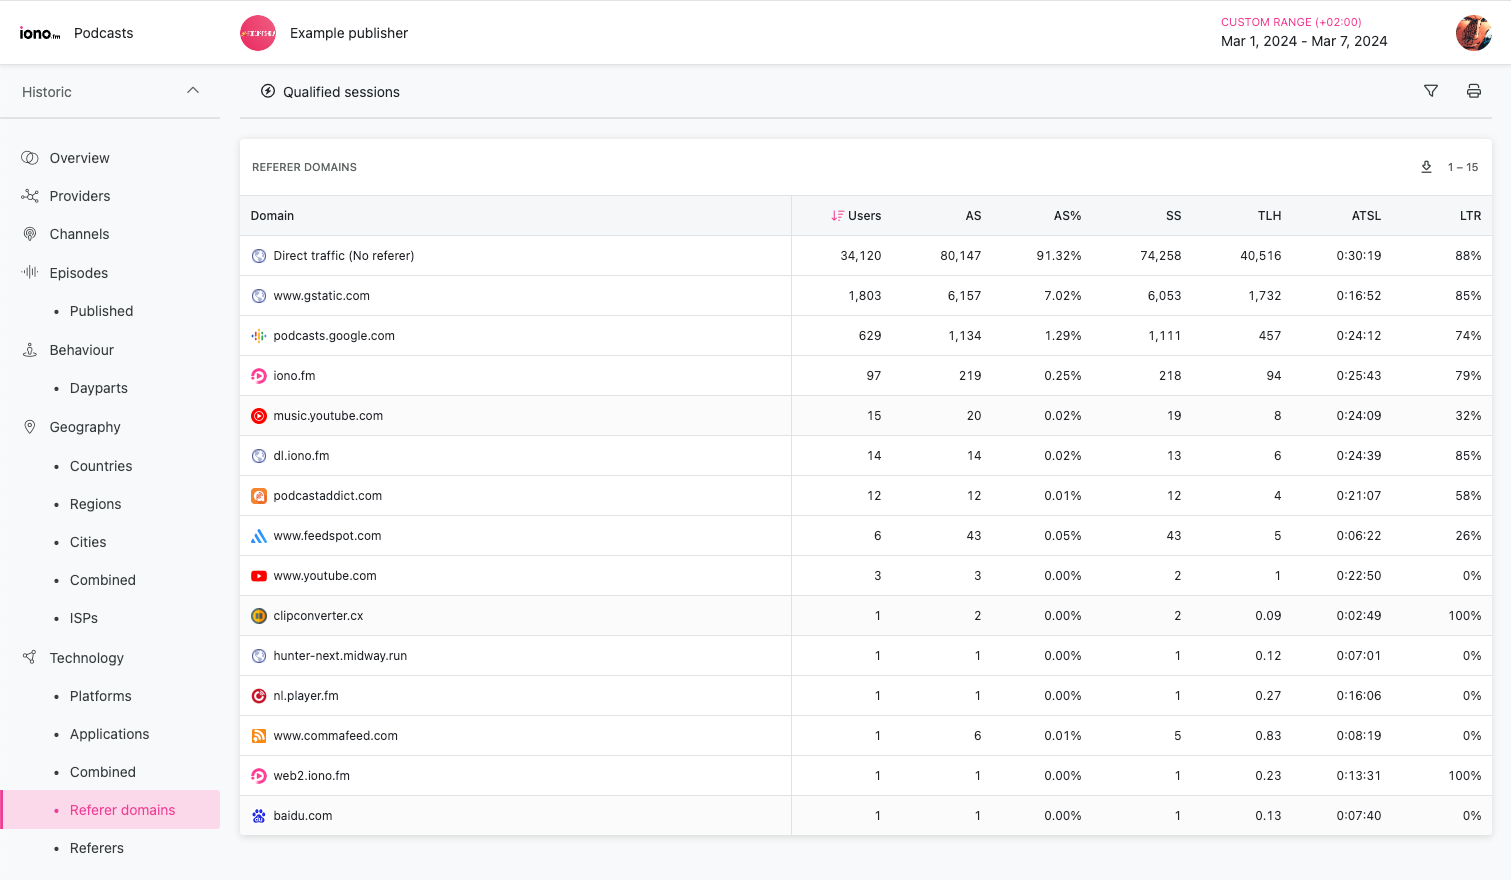
Whenever content is loaded from a browser, it may include a Referer header that indicates where the listener originated from.
Referer headers are only used by web browsers. A large part of the audience is typically listed as Direct traffic, which is any other third-party application consuming the content like a podcast or stream mobile app or a voice assistant.
The referer is usually a full web page URL, but this view groups by domain.
The misspelling of Referer is intentional due to the HTTP specification.
Referers
Shows the full list of Referer string without grouping by domain and including all the URL contents available to identify individual pages driving traffic.
Compatibility
The analytics dashboard works in all recent versions of popular browsers, and have been tested in Chrome, Firefox and Safari.
The dashboard has been designed to work optimally on medium sized displays in landscape mode. This includes all tablet, laptop and desktop screen resolutions.
The dashboard is fully functional on mobile devices but some UI aspects may not function perfectly.
Dashboard authentication requires cross-domain cookies and will not work in Safari's "Private Mode" or other private browsing features which disables these cookies.