The stream uptime heatmap provides a visual display of stream uptime.
Important: Heatmap data is only available from 15 November 2021.
Heatmap measurements
The heatmap data is assembled from volume measurements on the incoming stream audio. Silent measurements will not reflect as downtime on this graph, only times when both the primary and fallback contribution streams were offline.
The heatmap shows a window of 5 week's data, with the ability to scroll between time ranges:
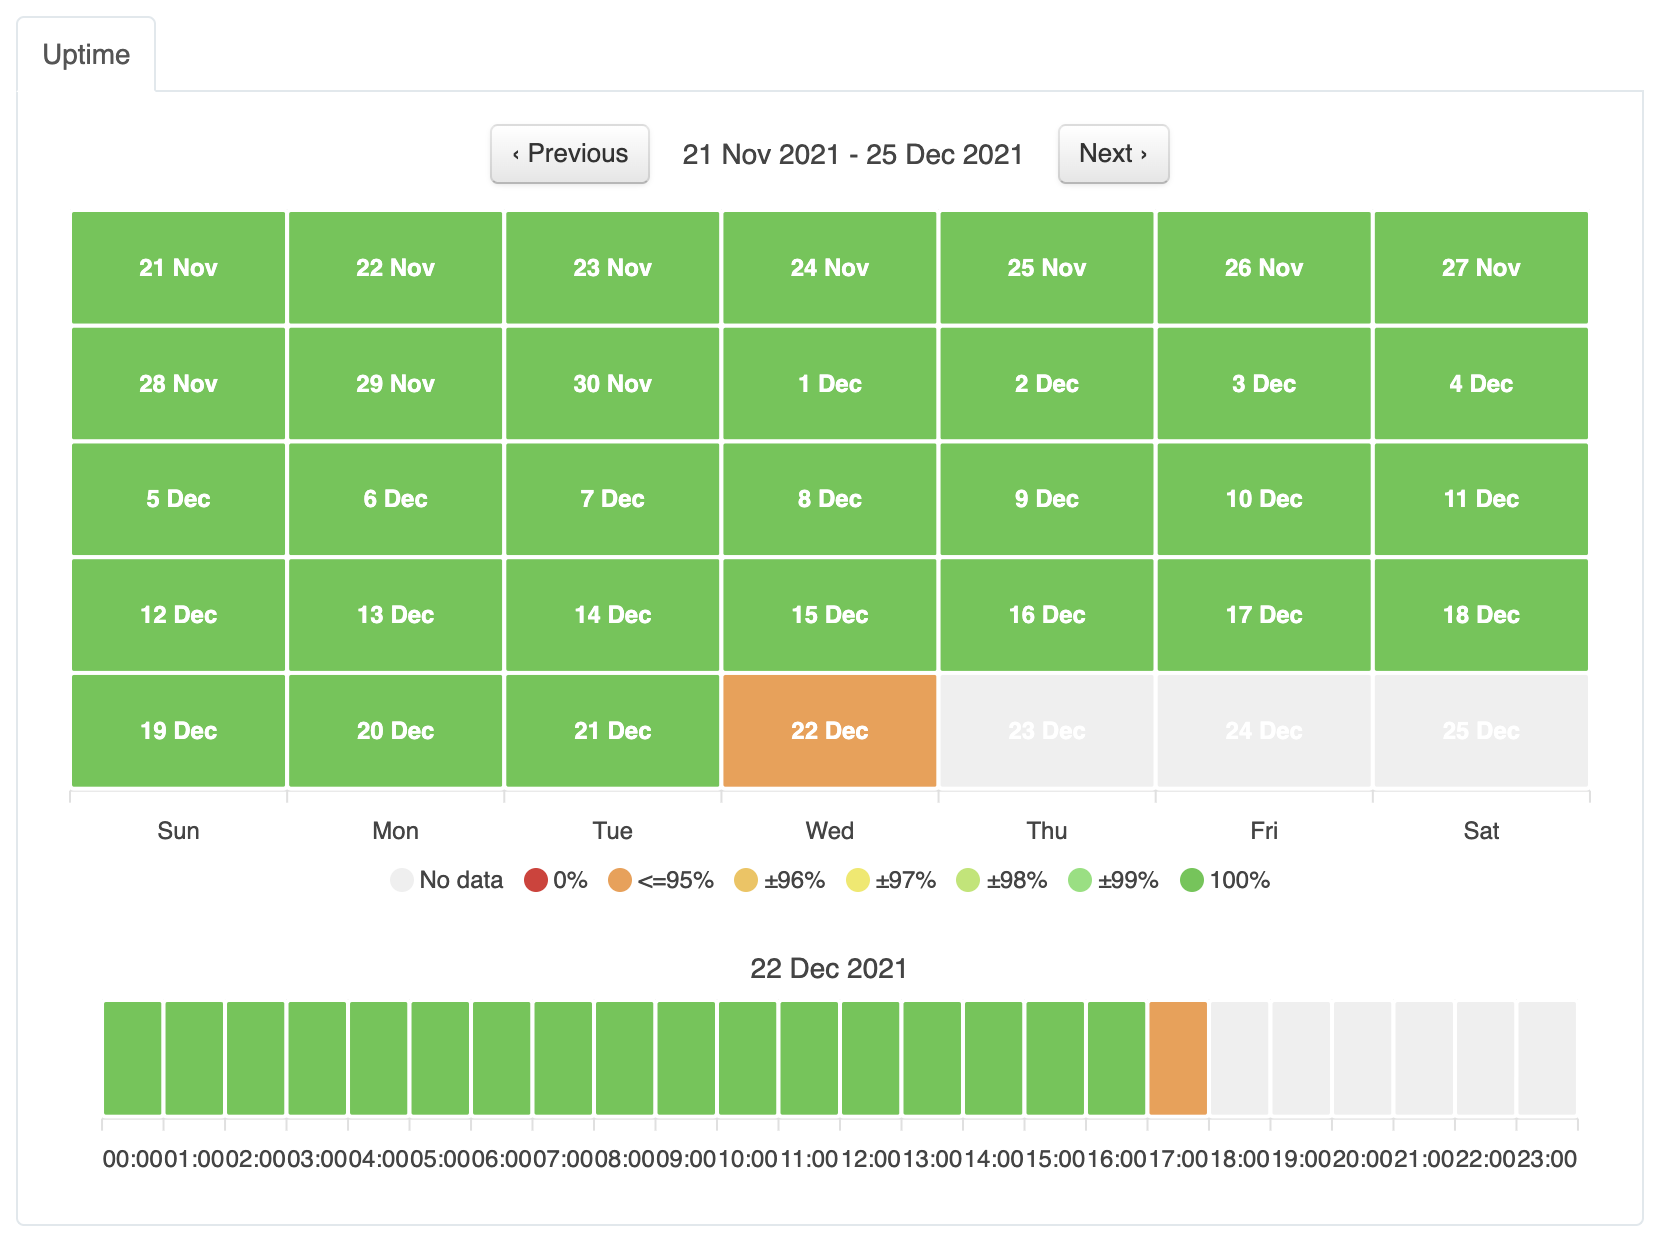
Clicking on a day in the main heatmap will load the data for that day in a graph below.
Uptime percentages
Heatmap data uses a color gradient based on the uptime percentage for the day or hour being represented. The legend below the heatmap shows the uptime percentages used.
100%- all data available for that day or hour , no downtime.99%- 15 minutes or less of downtime in a day.98%- 30 minutes or less of downtime in a day.97%- 45 minutes of less of downtime in a day.96%- 1 hour or less of downtime in a day.<95%- more than 1 hour of downtime in a day.0%- no data received for dayNo data- no data expected for time period.
These are approximated durations, for precise durations see uptime.is. When hovering over a cell it shows the exact amount of uptime minutes for that time.
A day needs 1440 minutes of uptime to count as 100% uptime and an hour 60 minutes.
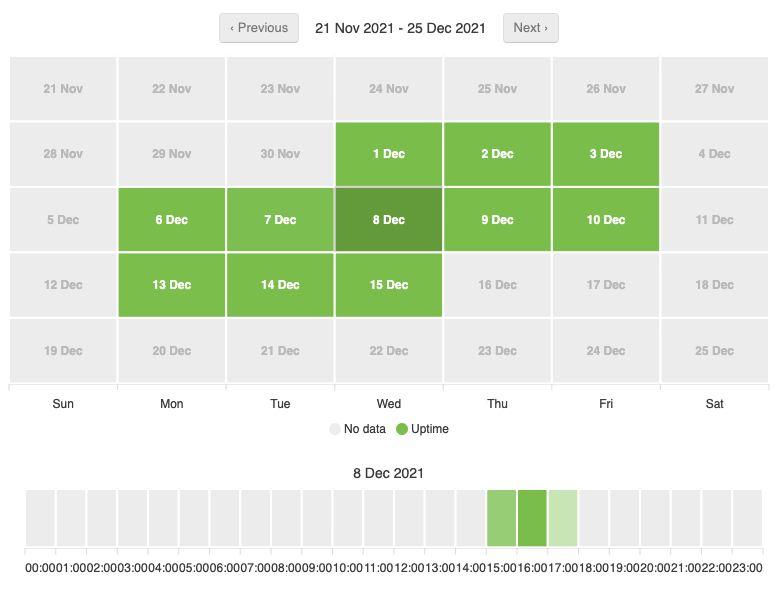
Event based streams
For any stream that does not broadcast 24/7, this uptime measurement is not very usefull as most days will have zero or limited data. To cater for this, any "Event based" stream is rendered using a simpler method to show which days had data, without calculating percentages.
Example: event based stream broadcasting on some weekdays 3pm and 6pm.